

Publication Designer Interface
The interface for designing Publications is similar to MS Word and offers multiple options for arrangement including size, orientation, layout, borders, backgrounds, etc.
Multiple content exhibits from multiple data sources are easily mashed together with corporate graphics or other image assets and text – all seamlessly added into the same document.
Once inside the Publications interface, you can see the workspace which contains several panels.
NOTE: Depending on the security role delineated in the admin console, the user can either view only, or view and write.
Follow the instructions found here on how to create a new publication.
Interface
The main panels are described below:
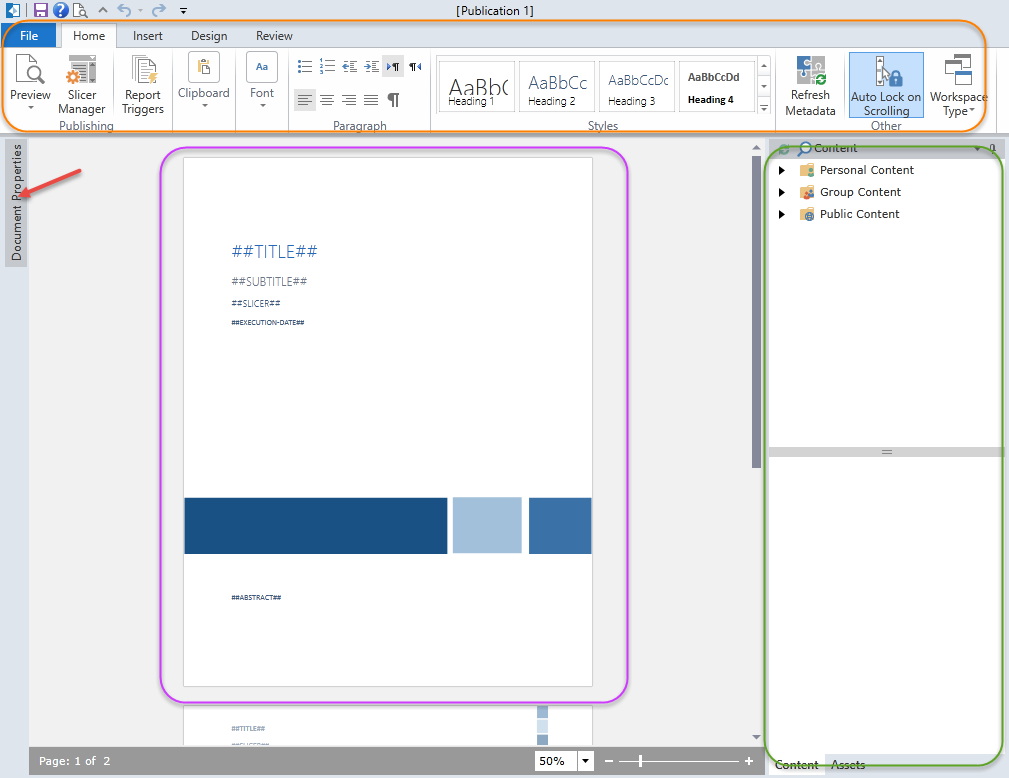
Ribbon Panel
(orange highlight)
Like other BI Office applications, all the application's commands are presented through the ribbon interface at the top of the workspace. Each tab of the ribbon provides access to the different functions of the application. This is described in further detail here.
Publication Panel
(purple highlight)
This panel is the main area of the application where you can build the report. There are numerous layout and formatting options that can be controlled from the main ribbon. Inserting analytics and assets are easy with the Content and Assets panel - and modifications are easy with the Component Tab.
For further functionalities in creating a Publication, click here.
Content and Assets Panel
(green highlight on the right)
The right-hand panel has two tabs:
Content – here you find the reporting content to add into the publication. When you click on a folder, the files within it are displayed in a tree structure. Click on the report and then the desired element to include it into the publication.
To add a reporting element to your publication, either double-click it or drag it onto the page. For more information on the Content and Assets panel, click here. To see more on how to add content to the document click here.
NOTE: You can click on the Refresh icon in the corner of the section to grab the most recent analytics.
Assets – here you find the graphic assets to add into the publication. When you click on a folder, the files within are displayed in a tree structure.
Document Properties Panel
(red arrow on the left)
This panel contains the information for the publication that will be rendered at runtime.
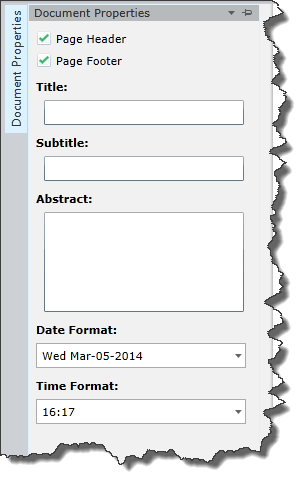
The fields are used to populate “hash tags” or dynamic values in the rendered document. Click here for further information.
NOTE: You can click on the drop-down menu next to the pushpin icon to have the panel “float” or be “docked”. To collapse the panel and only show the tabs, click “auto hide” or the pushpin icon.
Home |
Table of Contents |
Index |
User Community
Pyramid Analytics © 2011-2022